|
|
| show () |
| |
|
| __construct ($iWidth=null, $iHeight=null) |
| |
|
| setData ($tData) |
| |
|
| setColorTab ($tColor) |
| |
|
| setMarginLeft ($iMarginLeft) |
| |
|
| setMaxX ($iMaxX) |
| |
|
| setMinX ($iMinX) |
| |
|
| setMaxY ($iMaxX) |
| |
|
| setMinY ($iMinX) |
| |
|
| addMarkerY ($y, $color='#444') |
| |
|
| setPaddingX ($padding) |
| |
|
| setPaddingY ($padding) |
| |
|
| setGridY ($y, $color) |
| |
|
| setTextSizeLegend ($size) |
| |
|
| setCoordLegend ($x, $y) |
| |
|
| setStepX ($stepX) |
| |
|
| setStepY ($stepY) |
| |
|
| loadCanvas () |
| |
|
| startScript () |
| |
|
| endScript () |
| |
|
|
static | $uid =0 |
| |
|
| rect ($x, $y, $iWidth, $iHeight, $sColor) |
| |
|
| partPie ($x, $y, $diameter, $degStart, $degEnd, $sColor) |
| |
|
| text ($x, $y, $sText, $sColor='black', $font='10px arial') |
| |
|
| lineFromTo ($x, $y, $x2, $y2, $sColor='black', $opacity=1) |
| |
|
| $tData |
| |
|
| $iWidth |
| |
|
| $height |
| |
|
| $id |
| |
|
| $iMax =0 |
| |
|
| $sHtml |
| |
|
| $tColor |
| |
|
| $iMarginLeft |
| |
|
| $iMinX |
| |
|
| $iMaxX |
| |
|
| $iMinY |
| |
|
| $iMaxY |
| |
|
| $tMarkerY =array() |
| |
|
| $paddingX |
| |
|
| $paddingY |
| |
|
| $gridY |
| |
|
| $textsizeLegend |
| |
|
| $legendX =200 |
| |
|
| $legendY =50 |
| |
|
| $stepX =null |
| |
|
| $stepY =null |
| |
Definition at line 283 of file plugin_chart.php.
The documentation for this class was generated from the following file:

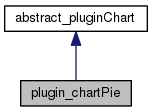

 Public Member Functions inherited from abstract_pluginChart
 1.8.6
1.8.6

